
Want more housing market stories from Lance Lambert’s ResiClub in your inbox? Subscribe to the ResiClub newsletter.
This week, the Federal Reserve Bank of New York published its quarterly Household Debt and Credit Report. It shows that while still low, distress is creeping back into the housing market.
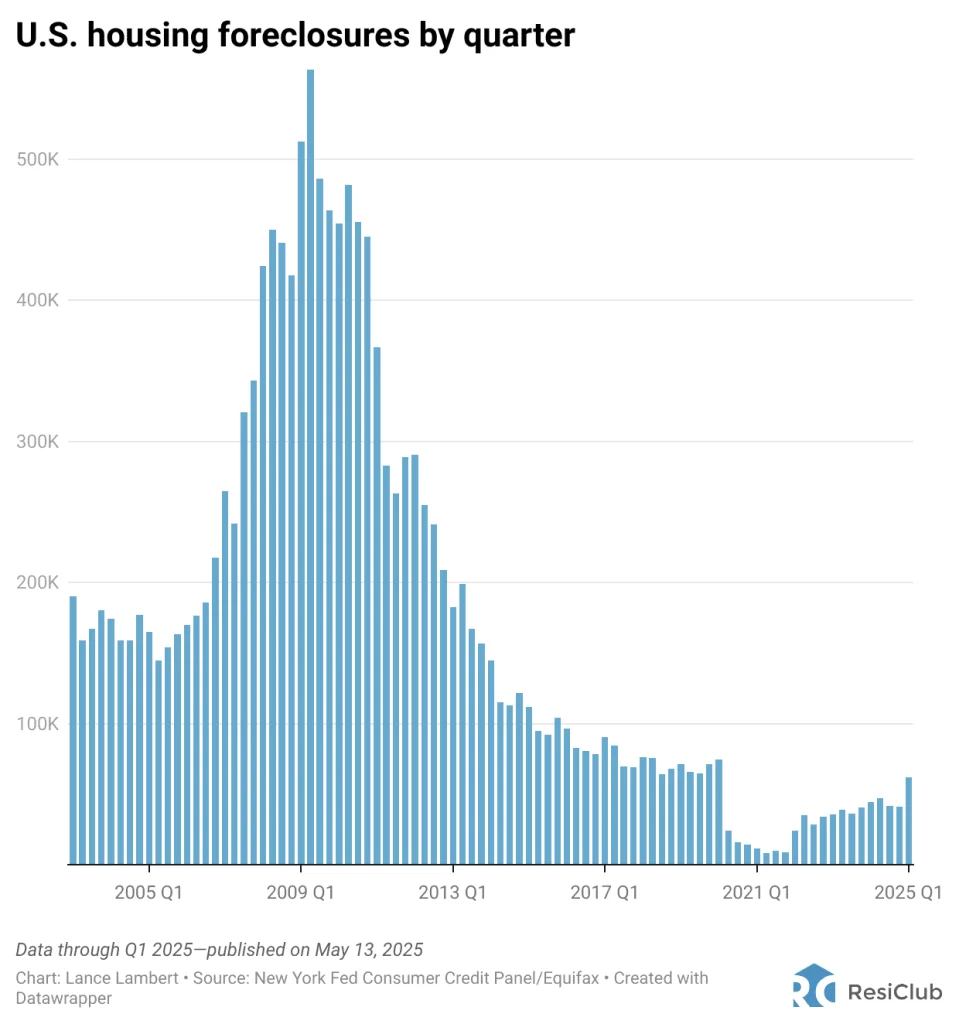
Here’s how the U.S. housing foreclosures in Q1 of 2025 compare to previous years:
Q1 2014: 144,500
Q1 2015: 111,820
Q1 2016: 96,680
Q1 2017: 90,460
Q1 2018: 76,360
Q1 2019: 71,040
Q1 2020: 74,720
Q1 2021: 11,400
Q1 2022: 24,220
Q1 2023: 35,640
Q1 2024: 44,180
Q1 2025: 61,660
When COVID-19 lockdowns began, the federal government implemented a nationwide foreclosure moratorium to protect homeowners from the economic fallout. These protections—including forbearance programs—were extended multiple times. At the same time, a historic surge in housing demand pushed home prices to new highs during the pandemic housing boom, boosting homeowner equity and keeping foreclosure activity unusually low.
But in recent quarters, foreclosures have steadily returned, inching closer to pre-pandemic 2019 levels. That foreclosure rebound picked up pace in Q1 2025, following the expiration of the moratorium on foreclosures of home loans backed by the U.S. Department of Veterans Affairs.
The question heading forward: Will housing foreclosures continue to rise through the rest of 2025 and in 2026? Let’s take a closer look at the leading indicators.
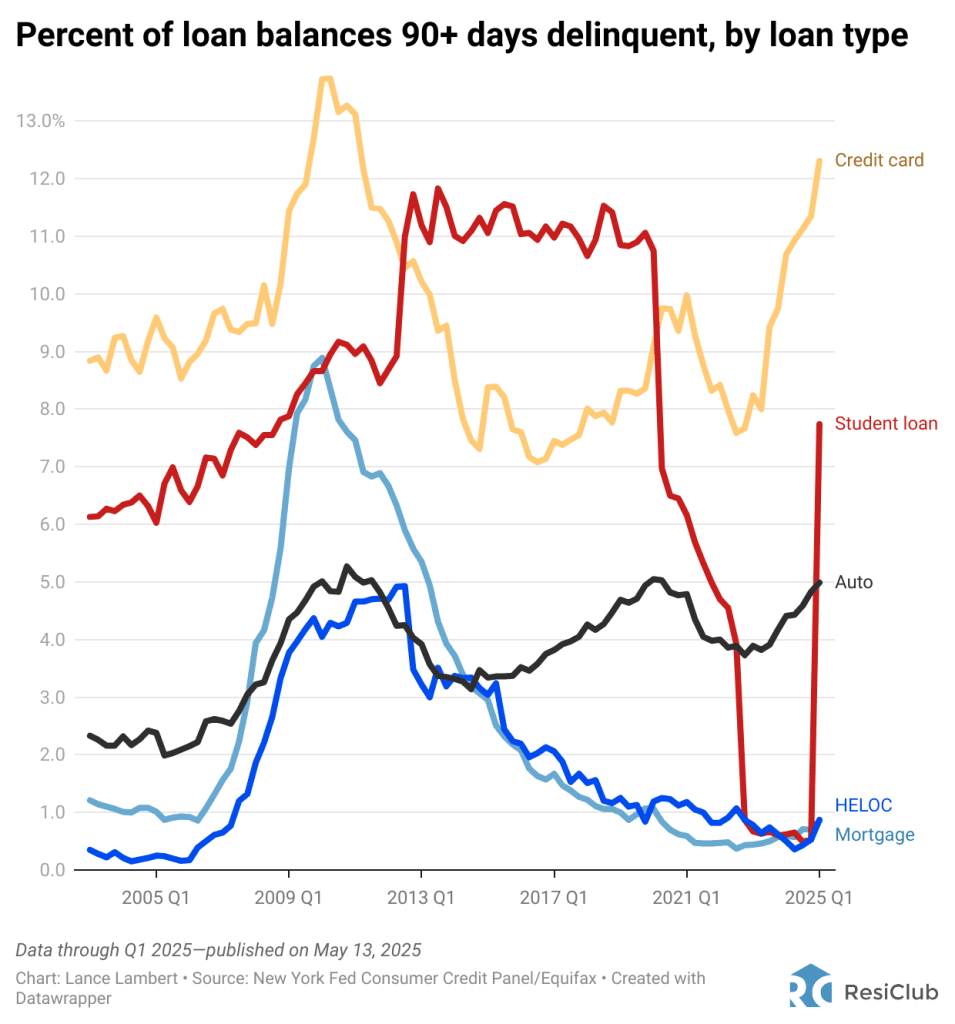
Before U.S. housing foreclosures rise, delinquencies of 90-plus days typically increase. While credit card and auto delinquencies of 90 days or more have surged in recent quarters, delinquencies of 90-plus days on household mortgages remain well below pre-pandemic 2019 levels.
Here’s how the recent share of household mortgage balances that are 90-plus days delinquent compares to previous years:
Q1 2014: 3.72%
Q1 2015: 2.95%
Q1 2016: 2.08%
Q1 2017: 1.67%
Q1 2018: 1.22%
Q1 2019: 1.00%
Q1 2020: 1.06%
Q1 2021: 0.59%
Q1 2022: 0.47%
Q1 2023: 0.44%
Q1 2024: 0.60%
Q1 2025: 0.86%
On the delinquency front, the most noticeable development this quarter is that student loan delinquencies surged to a five-year high in early 2025. While the jump was expected after years of artificially low student loan delinquency rates, Fed researchers warned of serious consequences for behind student-loan borrowers, including damaged credit and reduced access to mortgages and auto loans.
According to the New York Fed, superprime U.S. borrowers—those with credit scores above 760—who carry unpaid student loan balances are expected to see their credit scores drop by an average of 171 points this spring. That’s because student loan delinquencies, which hadn’t been reported to credit bureaus since the start of the pandemic, are now being reported again. This sudden credit hit could temporarily push some borrowers out of the housing market in 2025 and 2026.
The Treasury has also resumed collection tactics on student loans, including wage garnishment and tax refund seizures, raising questions about potential spillover into other areas of consumer credit.
And before 90-plus day delinquencies typically increase, 30-plus day delinquencies usually rise first. Indeed, 30-plus day mortgage delinquencies have returned to pre-pandemic 2019 levels.
Here’s how the portion of household mortgages transitioning into 30-plus days delinquent compares to historic data.
Q1 2014: 4.92%
Q1 2015: 4.05%
Q1 2016: 3.70%
Q1 2017: 3.51%
Q1 2018: 3.38%
Q1 2019: 3.50%
Q1 2020: 3.48%
Q1 2021: 1.59%
Q1 2022: 1.66%
Q1 2023: 2.43%
Q1 2024: 3.24%
Q1 2025: 3.71%
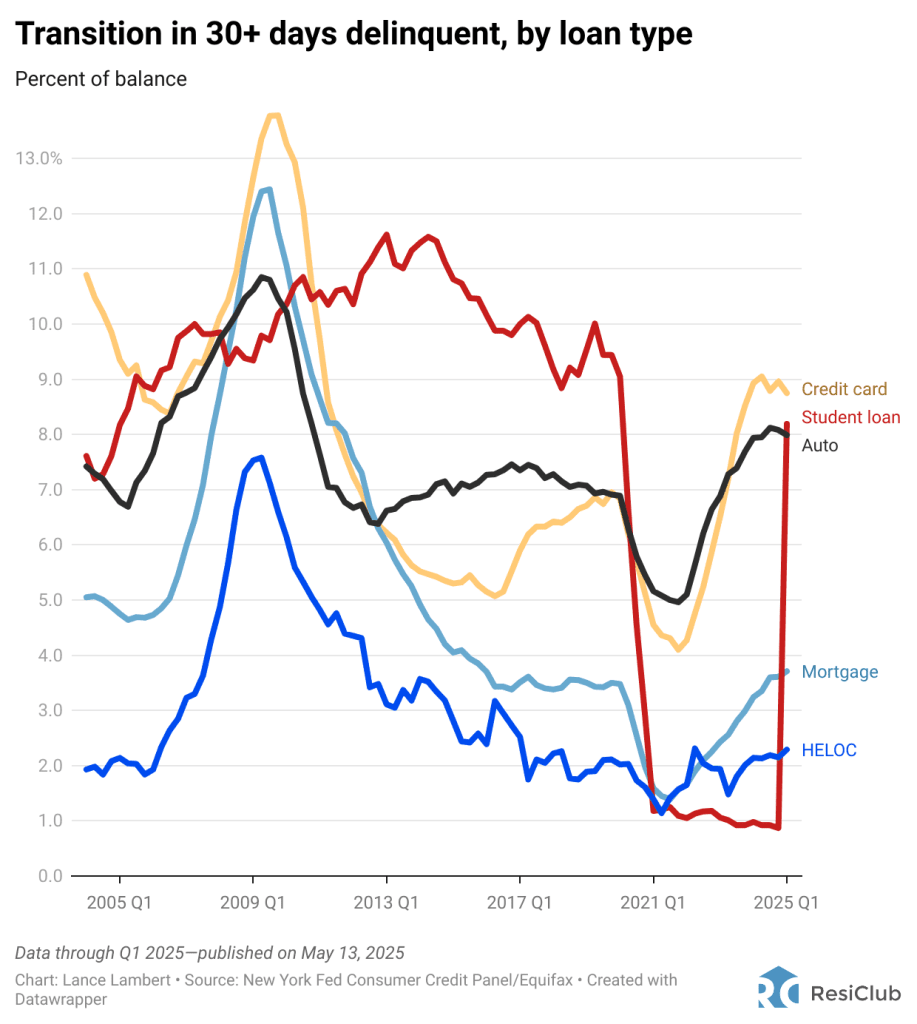
Big picture: While U.S. housing foreclosures remain low and below pre-pandemic 2019 levels, the 30-plus days delinquency data suggests that foreclosures could gradually near pre-pandemic 2019 by the end of 2025.